Statistics About Your Data. Keep An Eye On Your Whole Business. Beautiful And Full Time Reports For All Your Modules.
To enable data-driven decision-making by collecting, analyzing, and visualizing business data across departments such as sales, finance, operations, inventory, and customer service.
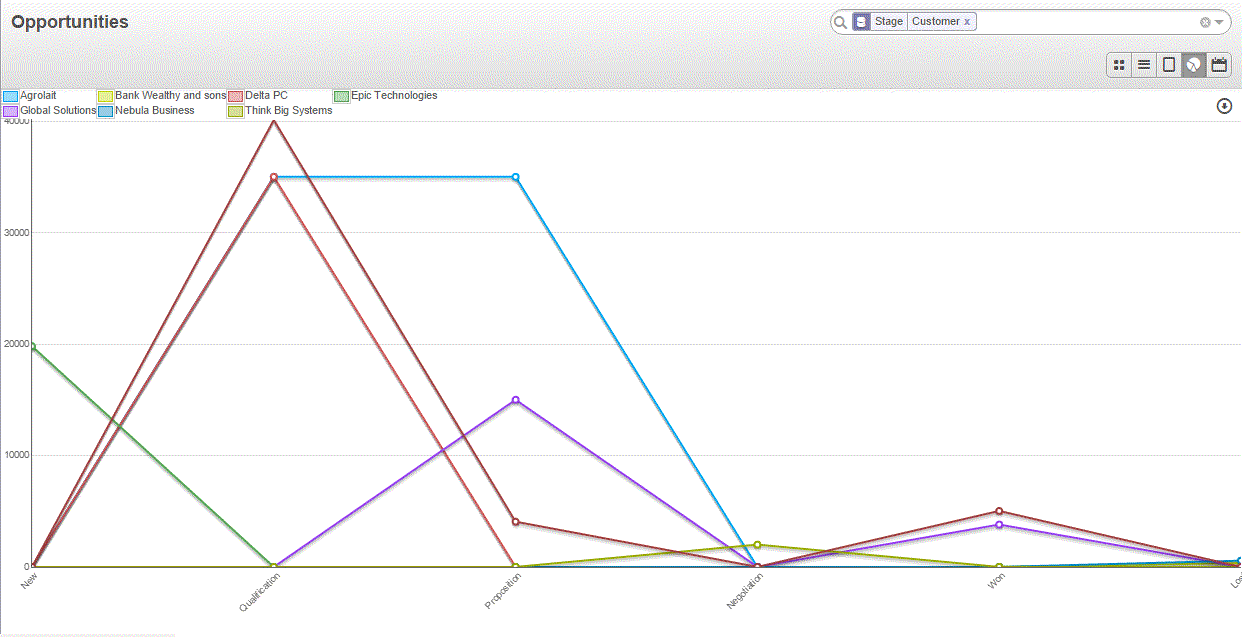
Generate Graphs and Charts In Just A Click
Create detailed reports and graphs in any format you like without the need of an external program.
The Information You Need The Way You Need It
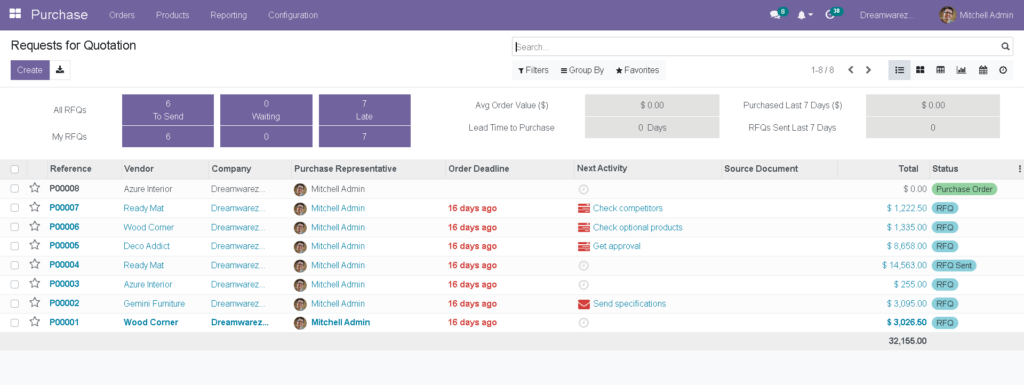
Filter all results to fit your field of research
Filter and group each analysis using built-in filters, and create custom filters to gather only the information you are looking for. Save the filters you created in your favorites to access them anytime in just a click.
Dashboards
Birds Eye View of Everything That Matters
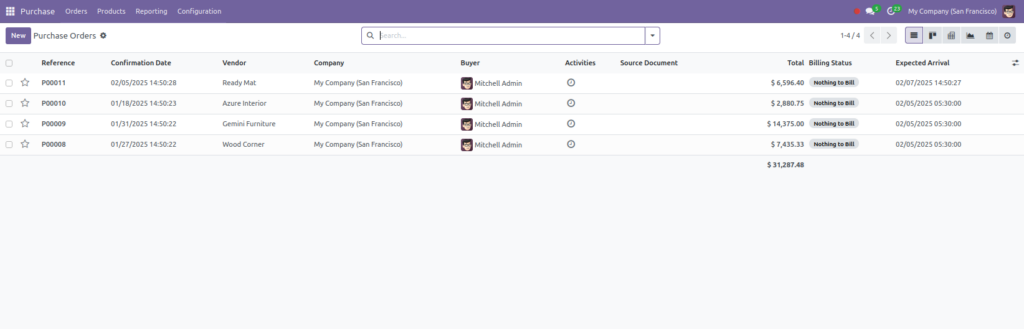
Dreamwarez comes pre-configured with several dashboards to get you started, to show you whats going on and what needs action. All of which updates dynamically.
You can create your own dashboards from any of the tree,graph or calendar views with custom filters and group-bys if necessary.
The Most Advance Report Engine
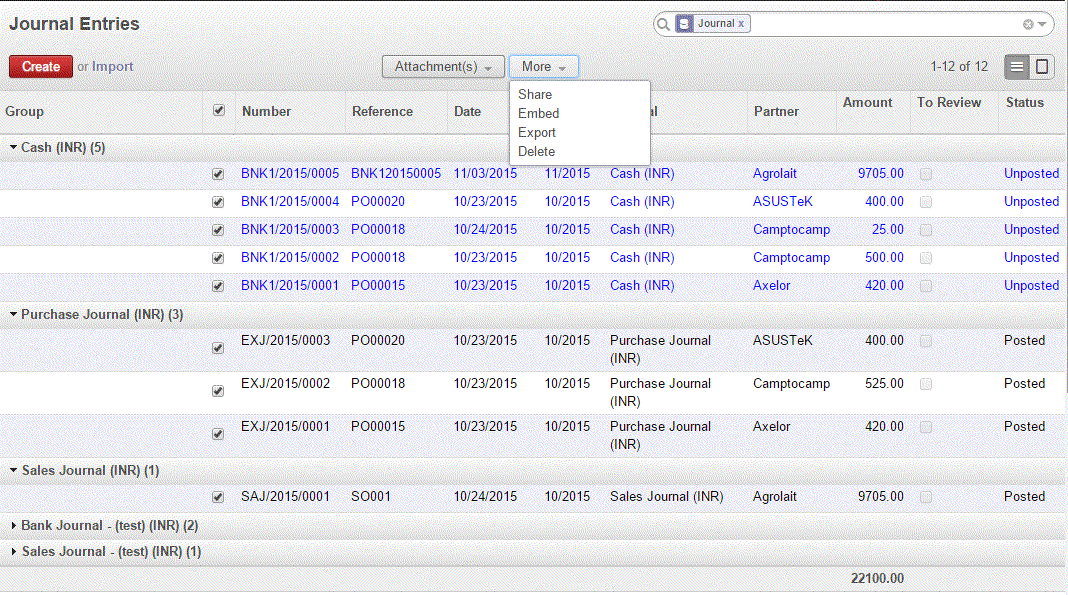
Generate New Custom Reports On The Fly
Slice and Dice to get the data that you want to export the current tree view with the printscreen function (current screen to excel). Or just with a few clicks choose the fields or headers that you wish to see on the report and click exports. It’s that easy!
Power up your workflow with integrations into your favourite tools